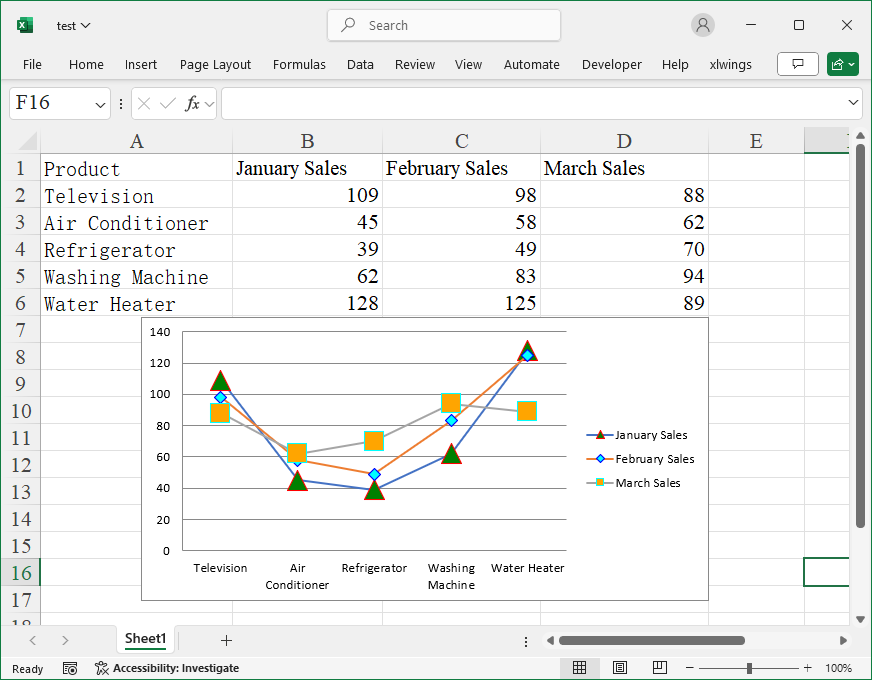
How to set properties of points in a chart?
Code:
#Set Point Properties

from openpyxl import Workbook, load_workbook
from openpyxl.chart import LineChart, Reference
from openpyxl.chart.marker import DataPoint,Marker
from openpyxl.chart.shapes import GraphicalProperties
from openpyxl.drawing.colors import ColorChoice
from openpyxl.drawing.line import LineProperties

# Read the file
wb=load_workbook('Sales.xlsx')
# Select the first worksheet
ws=wb.worksheets[0]

# Get the data from the range B2:D6 and save it as a Reference object
data=Reference(ws, min_col=2, min_row=1, max_col=4, max_row=6)
# Get the data from the range A2:A6 for the x-axis of the bar chart
labels=Reference(ws, min_col=1, min_row=2, max_col=1, max_row=6)

# Create a bar chart object
chart=LineChart()
# Set the data source
chart.add_data(data, titles_from_data=True)
# Set x-axis labels
chart.set_categories(labels)

#Modify point marker properties for Series 1
chart.series[0].marker=Marker(
    size=16,
    symbol='triangle',
    spPr=GraphicalProperties(
        ln=LineProperties(
            solidFill='FF0000',
            w=10000
        ),
        solidFill=ColorChoice(
            prstClr='green'
        )
    )
)

#Modify point marker properties for Series 2
chart.series[1].marker=Marker(
    size=10,
    symbol='diamond',
    spPr=GraphicalProperties(
        ln=LineProperties(
            solidFill='0000FF',
            w=10000
        ),
        solidFill=ColorChoice(
            prstClr='cyan'
        )
    )
)

#Modify point marker properties for Series 3
chart.series[2].marker=Marker(
    size=15,
    symbol='square',
    spPr=GraphicalProperties(
        ln=LineProperties(
            solidFill='00FFFF',
            w=10000
        ),
        solidFill=ColorChoice(
            prstClr='orange'
        )
    )
)

# Insert the chart into the worksheet
ws.add_chart(chart, 'E3')
# Save the workbook
wb.save('test.xlsx')