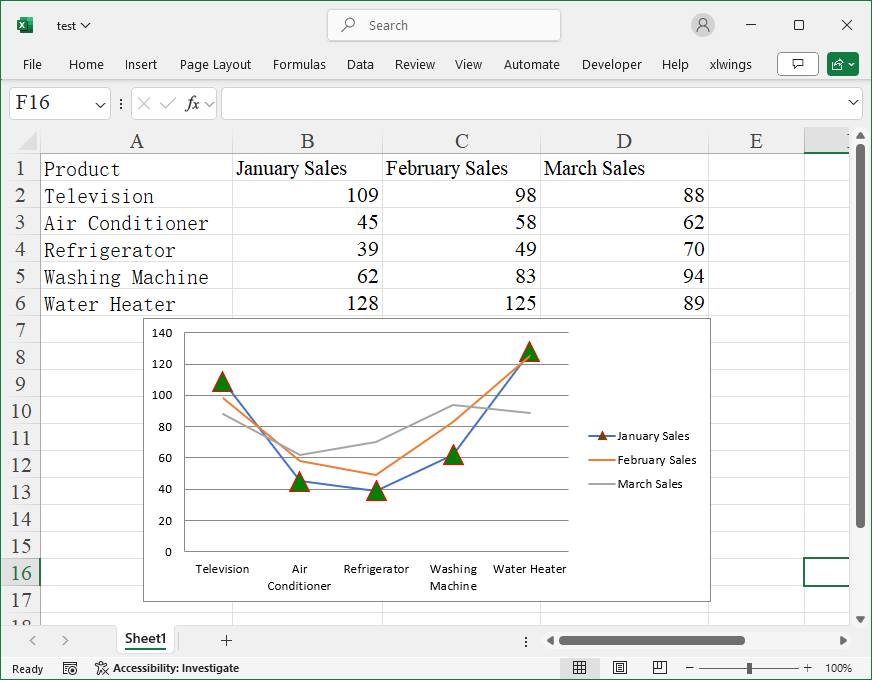
How to set colors of graphical elements in a chart?
Code:
#Set Colors

from openpyxl import Workbook, load_workbook
from openpyxl.chart import LineChart, Reference
from openpyxl.chart.marker import DataPoint,Marker
from openpyxl.chart.shapes import GraphicalProperties
from openpyxl.drawing.colors import ColorChoice,SchemeColor,SystemColor,HSLColor
from openpyxl.drawing.line import LineProperties

# Read the file
wb=load_workbook('Sales.xlsx')
# Select the first worksheet
ws=wb.worksheets[0]

# Get the data from the range B1:D6 and save it as a Reference object
data=Reference(ws, min_col=2, min_row=1, max_col=4, max_row=6)
# Get the data from the range A2:A6 for the x-axis of the bar chart
labels=Reference(ws, min_col=1, min_row=2, max_col=1, max_row=6)

# Create a bar chart object
chart=LineChart()
# Set the data source
chart.add_data(data, titles_from_data=True)
# Set x-axis labels
chart.set_categories(labels)

#Set the point marker color for the first series
chart.series[0].marker=Marker(
    size=16,
    symbol='triangle',
    spPr=GraphicalProperties(
        ln=LineProperties(
            solidFill='FF0000',
            w=10000
        ),
        #solidFill='00FF00'
        solidFill=ColorChoice(
            #hslClr=HSLColor(hue=20,lum=80,sat=50)                #Hue, Saturation, Lightness
            prstClr='green'
            #schemeClr=SchemeColor(val='accent2')    #{'accent1','bg2','hlink','accent2','dk1','bg1','folHlink','tx1','accent4',''accent6','phClr','dk2', 'accent5', 'lt1', 'tx2', 'accent3','lt2'}
            #sysClr=SystemColor(val='gradientActiveCaption')  #
            #{'window', 'gradientActiveCaption', 'background', 'activeCaption', 'inactiveCaption', 'menuText', 'infoBk', 'menu', 'scrollBar', 'menuHighlight', 'inactiveCaptionText', 'activeBorder', 'highlightText', 'windowFrame', 'appWorkspace', '3dLight', 'menuBar', 'hotLight', 'infoText', 'btnFace', 'highlight', 'btnText', 'inactiveBorder', 'gradientInactiveCaption', 'windowText', 'captionText', '3dDkShadow', 'btnHighlight', 'btnShadow', 'grayText'}
        )
    )
)

# Insert the chart into the worksheet
ws.add_chart(chart, 'E3')
# Save the workbook
wb.save('test.xlsx')