How to get series in charts and modify their properties?
Code:
#Series
# Import relevant modules such as Workbook, load_workbook,
# and charts from openpyxl
from openpyxl import Workbook, load_workbook
from openpyxl.chart import LineChart, Reference, Series
# Read the file
wb = load_workbook('Sales.xlsx')
# Select the first worksheet
ws = wb.worksheets[0]
# Get the data from the range B1:D6 and save it as a Reference object
data = Reference(ws, min_col=2, min_row=1, max_col=4, max_row=6)
# Get the data from the range A2:A6 for the x-axis of the bar chart
labels = Reference(ws, min_col=1, min_row=2, max_col=1, max_row=6)
# Create a bar chart object
chart = LineChart()
# Set the data source
chart.add_data(data, titles_from_data=True)
# Set x-axis labels
chart.set_categories(labels)
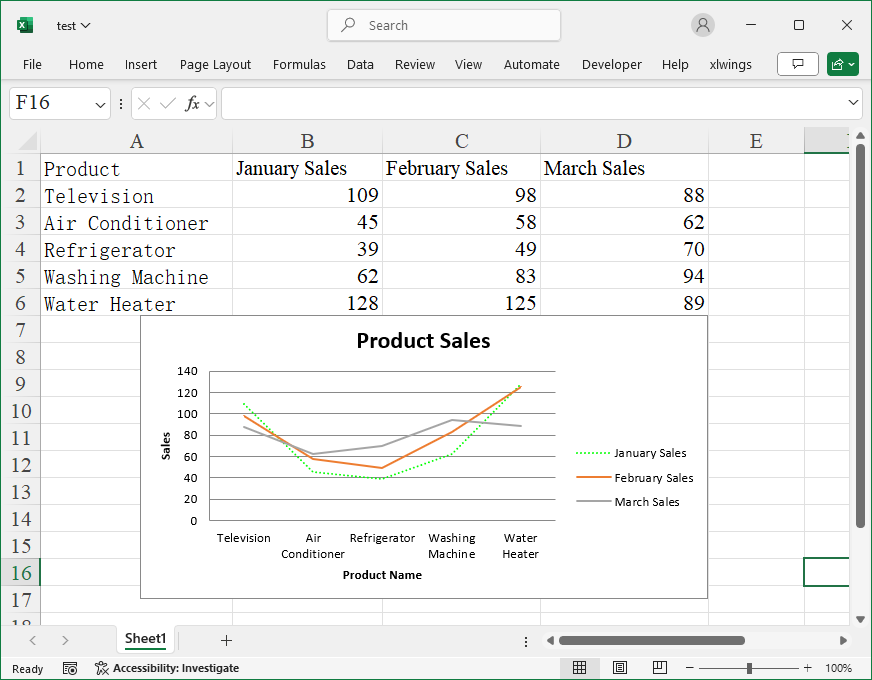
#Get the first series and modify its properties
ser=chart.series[0]
ser.graphicalProperties.line.solidFill='00FF00'
ser.graphicalProperties.line.Width=600000
ser.graphicalProperties.line.dashStyle='sysDot'
# Set chart and axis titles
chart.title='Product Sales'
chart.x_axis.title='Product Name'
chart.y_axis.title='Sales'
# Insert the bar chart into a specified cell
ws.add_chart(chart, 'E2')
# Save the file
wb.save('test.xlsx')